4.3 A workflow for uncovering intron retention in a zebrafish experiment
In the study of gene regulation, there is much interest in uncovering the effects of aberrant minor class splicing (called U12 splicing) on the transcriptome. Minor class splicing is a regulatory process where a class of introns (called U12 introns in this case but there exist other classes in eukaryotic organisms such as U2 introns) are removed from pre-mRNA prior to gene expression (Turunen et al. 2013). The removal of these introns is catalysed by small ribonucleoproteins (snRNPs) which identify key motifs and branch sites in the intron to begin splicing (Markmiller et al. 2014). Here we describe an exploratory workflow for finding coverage traces with evidence for intron retention using RNA-seq data from a knockout experiment in zebrafish obtained from the Heath Lab at Walter and Eliza Hall Institute. Code for this analysis is available at https://github.com/sa-lee/thesis/tree/master/scripts/superintronic.R.
The data consist of 11 zebrafish samples from single-end polyA enriched RNA-seq libraries pooled from zebrafish larvae. The experimental factors looked at combinations of genotype (whether the gene rnpc3 has been knocked out or not) and line (whether the zebrafish larvae have the caliban cal or mutant caliban zm-cal phenotype). Within each combination there are three biological replicates, except for the combination zm-cal and wild-type rnpc3 which had two replicates.
FASTQ files were aligned to the GRCz11 reference genome using subjunc with the default parameters called from Rsubread to produce BAM files for each sample (Liao, Smyth, and Shi 2013, 2019). The coverage was then estimated directly from the set of BAM files using superintronic into the long form GRanges representation we described above.
The gene annotation files were obtained as GFF files from RefSeq as is standard for Zebrafish analyses. The GFF was used to construct the exonic and intronic parts of each gene as GRanges object using superintronic. We further filtered genes that had a single exon or genes that were overlapping others in the annotation and that were not on the main contigs of the reference genome (i.e. excluding mitochondria) to simplify our analysis and reduce any coverage ambiguity. This left 18,270 genes available for computing data descriptors on in order to detecting IR-like coverage traces. Across each combination of genotype and line, we first \(\log_2\) transformed the coverage score with an offset of one, and then intersected the coverage GRanges with exonic and intronic features of each gene. For each gene, the mean and standard deviation of the log-transformed coverage score weighted by the number of bases covered were computed over all intron and exon parts within the groupings of genotype and line. We also computed the bases above descriptor for intron features. It refers to the total number of bases within an intron that has a score above the overall average exon coverage score. The scatter plot matrix view of these descriptors is shown in Figure 4.3 for a single biological group in the experiment. Using these views and by summarising over the data descriptors, we came up with thresholds for finding genes that have IR-like traces within each biological group.
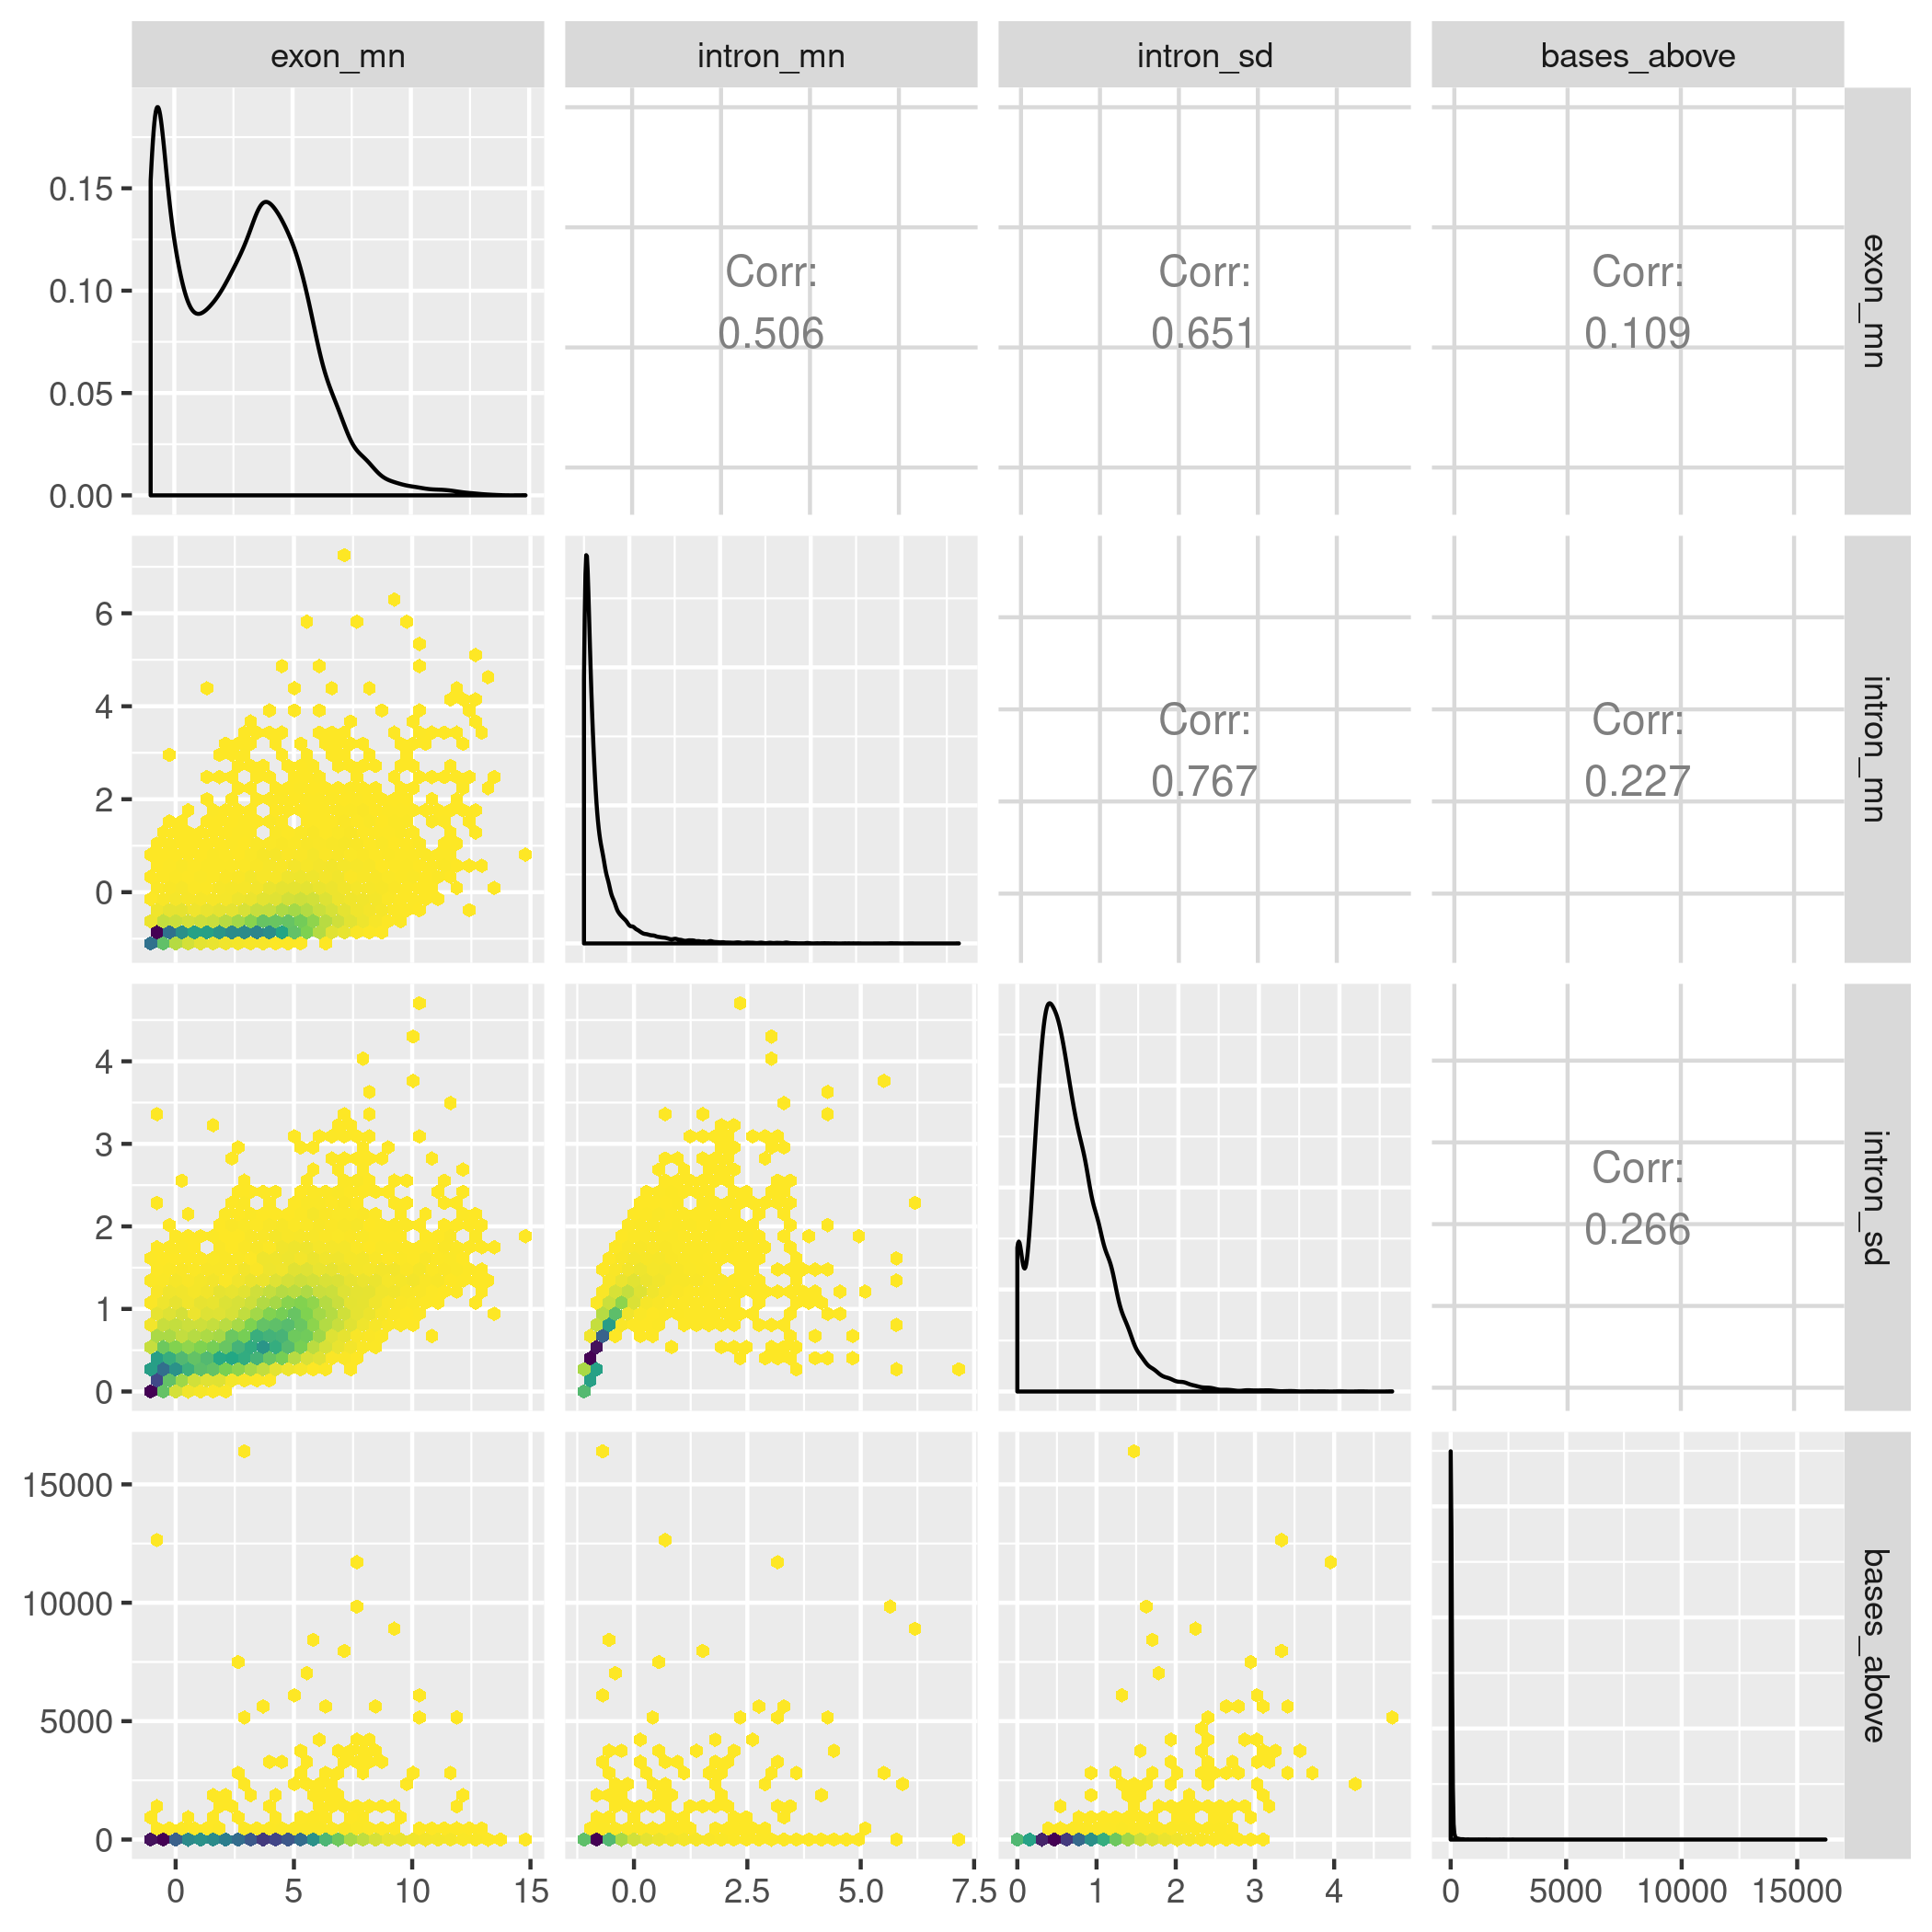
Figure 4.3: A hexbin scatter plot matrix of the data descriptors estimated for the cal rnpc3 knock out zebrafish line. To identify coverage traces with IR like events, we want a set of descriptors that will find genes with the following characteristics: the gene is “expressed” that has a large number of intron bases relative to the coverage of other intron features, and has relatively stable coverage within exon features. To do this we looked at the descriptor, as well as computing the the mean and standard deviation of both exon and intron features.
We selected genes with the following thresholds: genes have an average exon log-coverage greater than the mean of average exon log-coverage values across all genes, have an average intron log-coverage greater than the average standard deviation of exon log-coverage values over all genes, and the standard deviation of intron log-coverage values is twice the standard deviation of exon log-coverage values. That is, we are selecting genes that are expressed but have large average intron expression that is more variable than the gene’s exon expression. This results in a total of 86 genes selected to link back to their underlying coverage traces, with the overlaps shown in the UpSet plot in Figure 4.4 (Lex et al. 2014). The procedure produces gene coverage traces with known minor class splice sites affected by the knockout procedure such as ccdc43 and nat15 (figures 4.5 and 4.6), as well as some that appear to have U12 intron retention like events such as mapk3 or tspan31 (figures 4.7 and 4.8) that affect other parts of the gene.
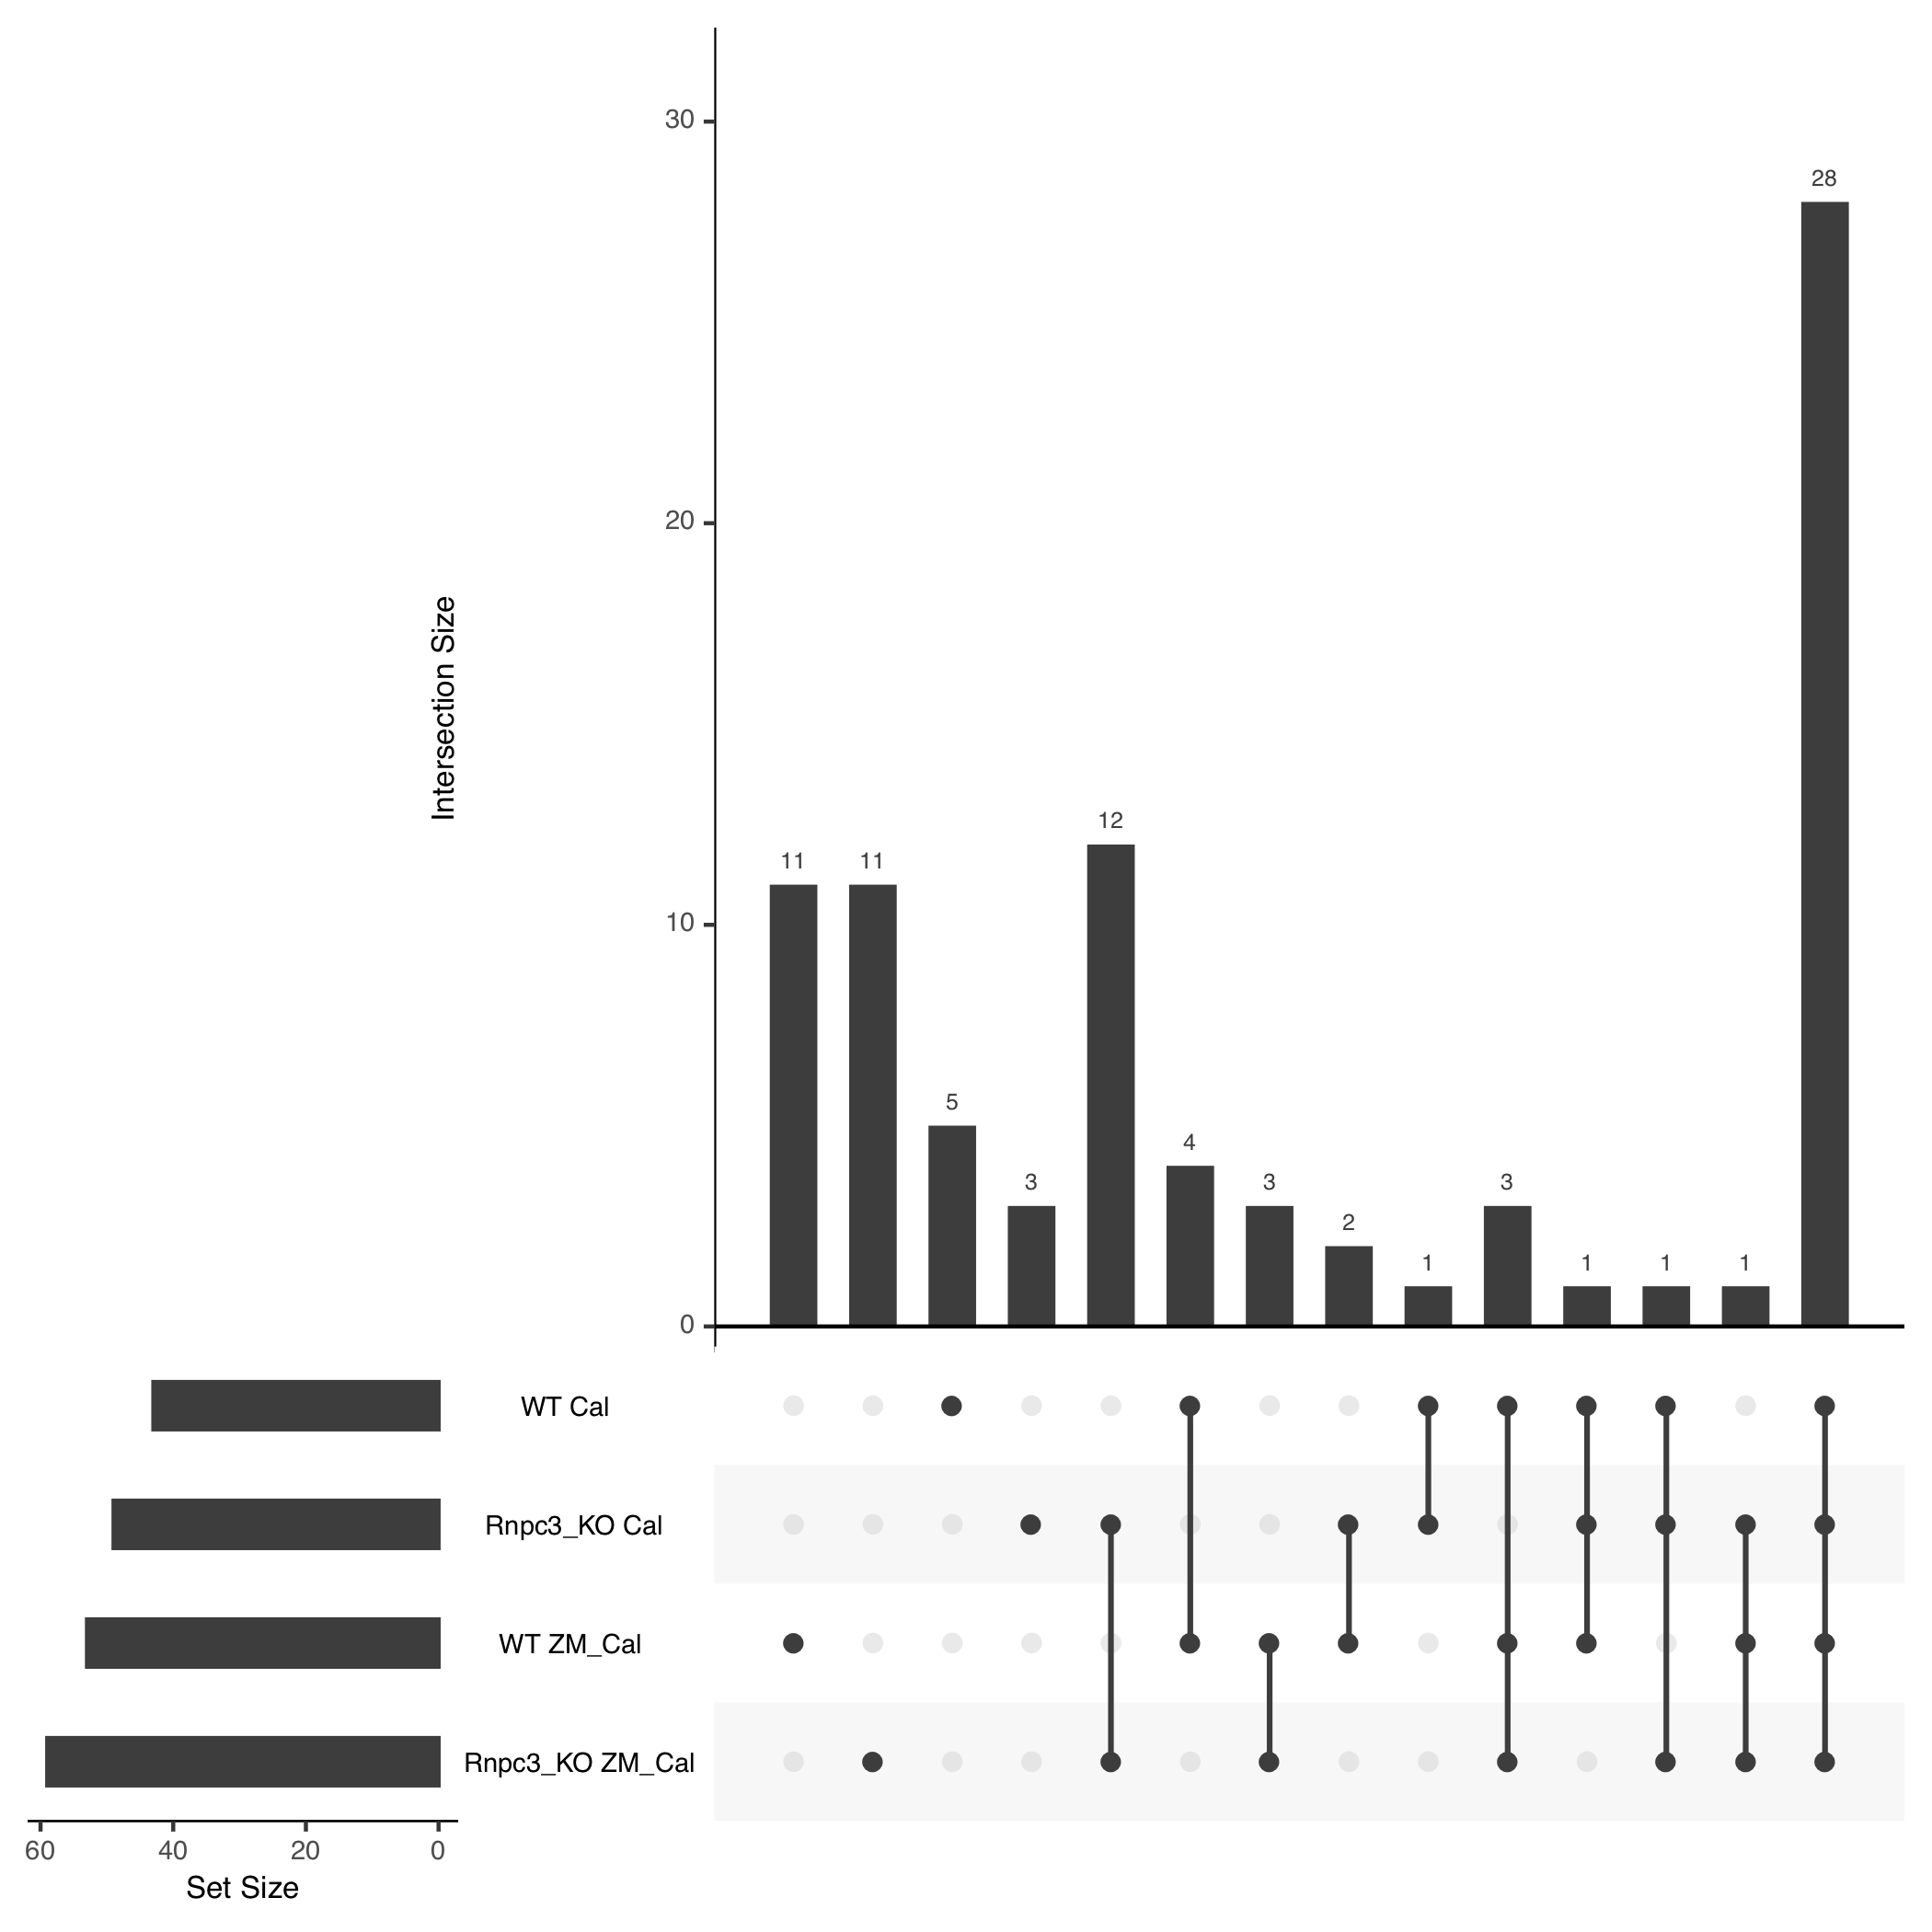
Figure 4.4: Gene overlaps found between each combination of genotype and line using the thresholds defined in the text. Our procedure mostly finds genes with IR like profiles across all groups (28 shared between all four) or that is unique to a single group, since we do not consider looking at differential IR and run our thresholding separately for each group of replicates. The rnpc3 knockout lines share the largest overlap in results.
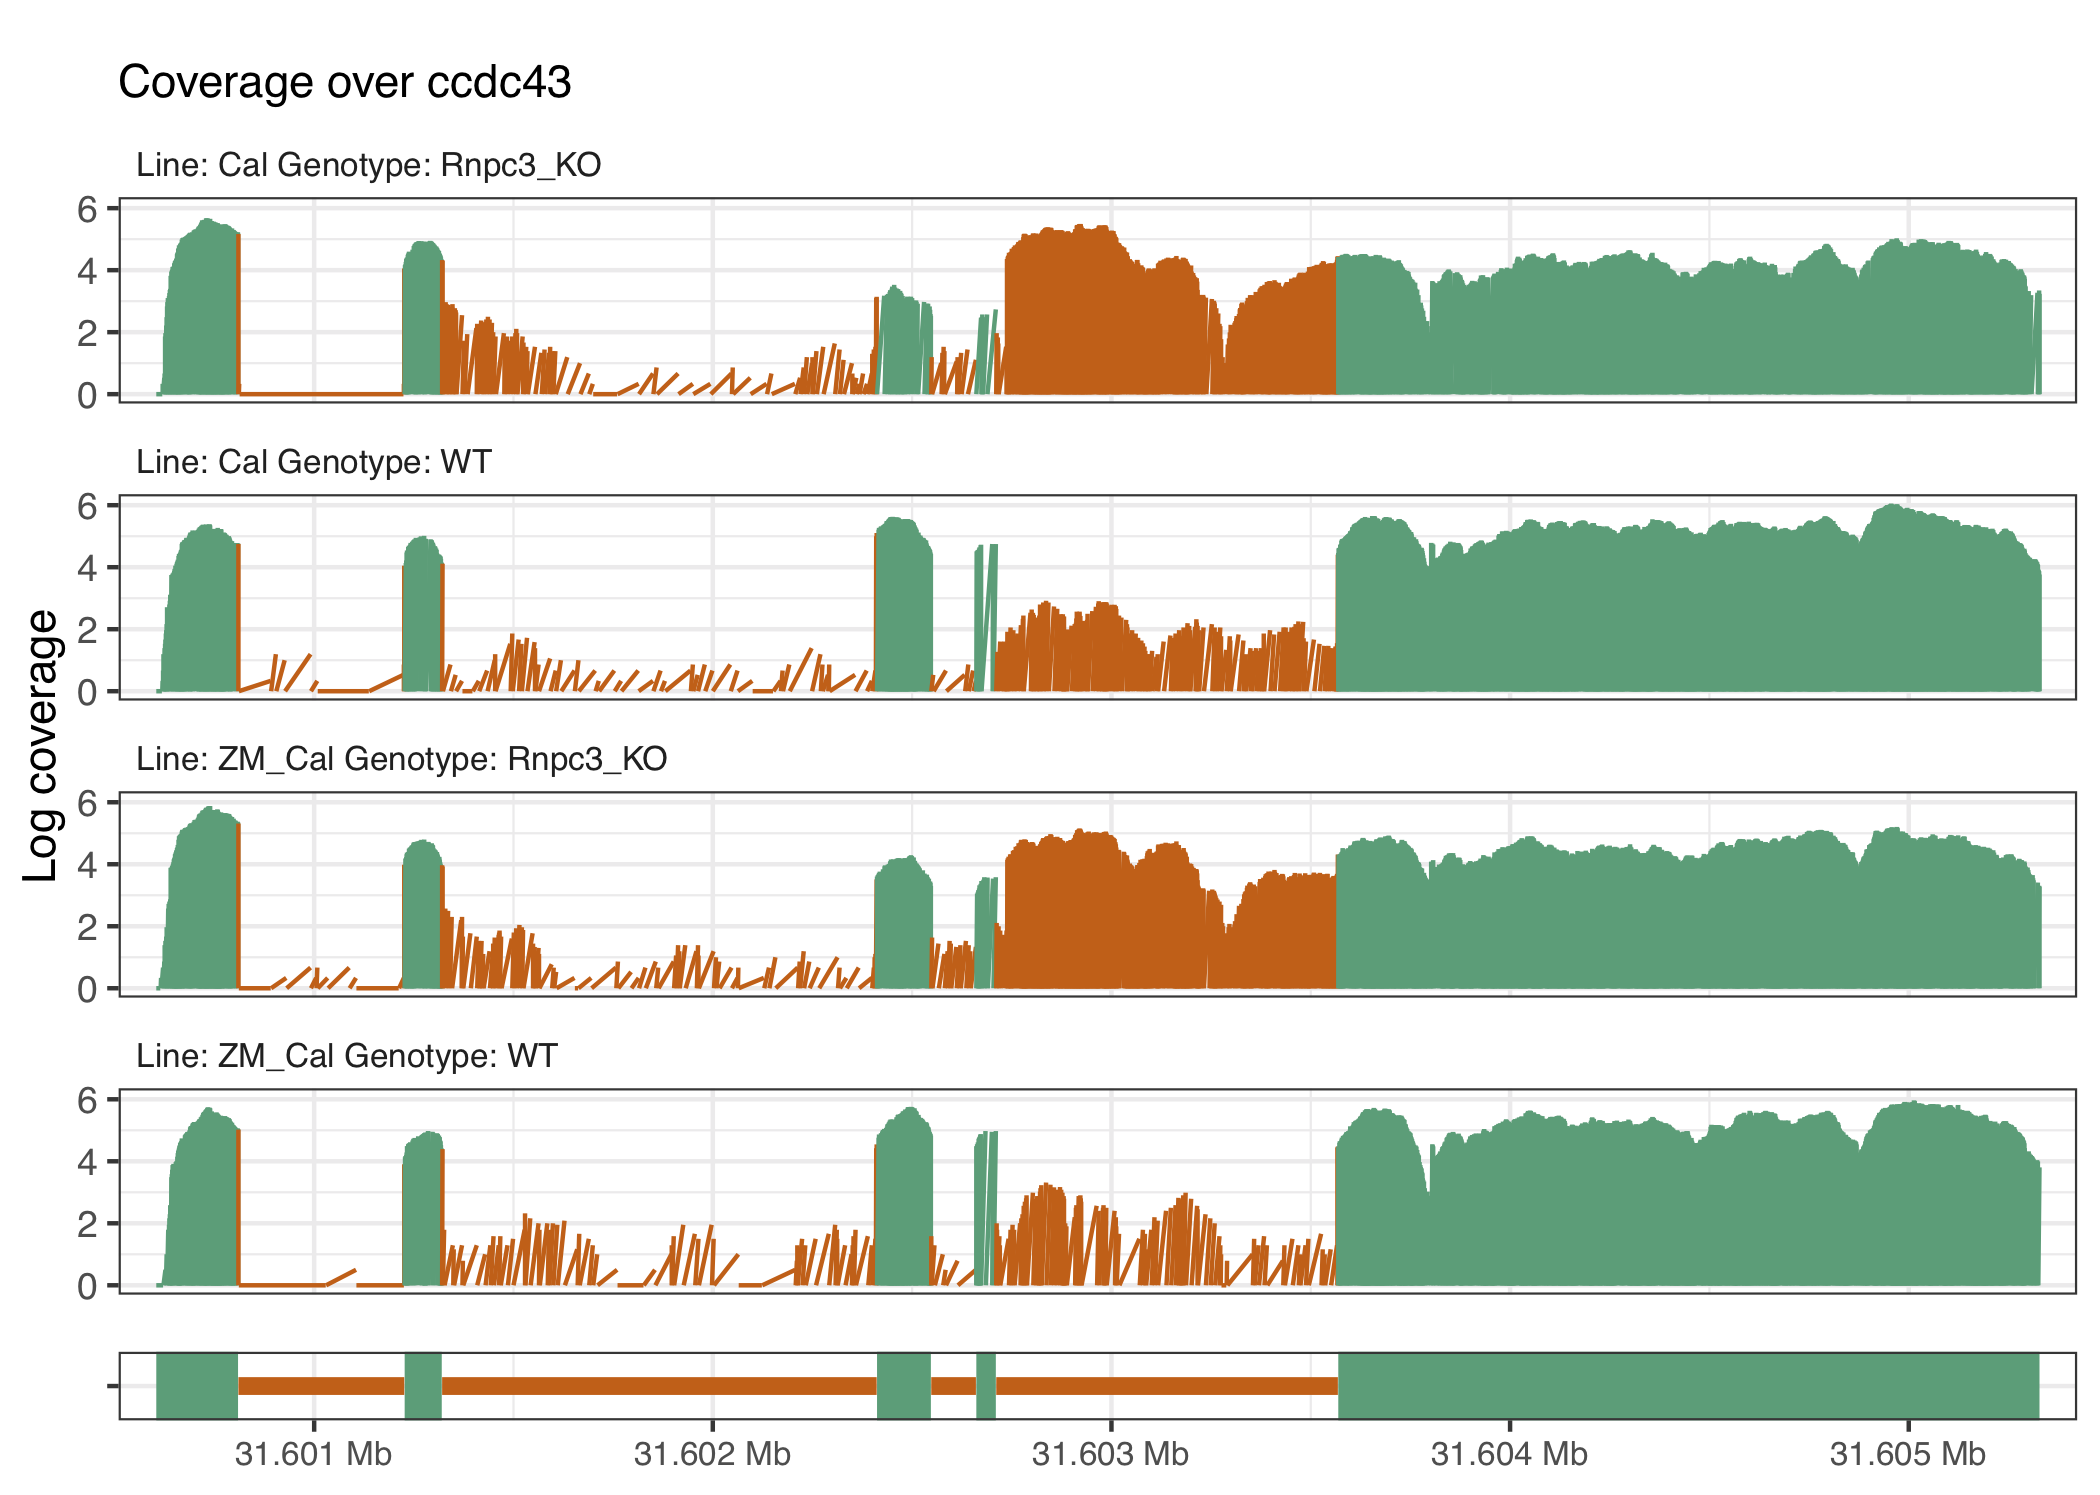
Figure 4.5: The ccdc43 gene is known to have enhanced U12 intron retention in the caliban phenotype and increase retention when rnpc3 is knocked out as can be seen directly from the intron located at around 31.603Mb.
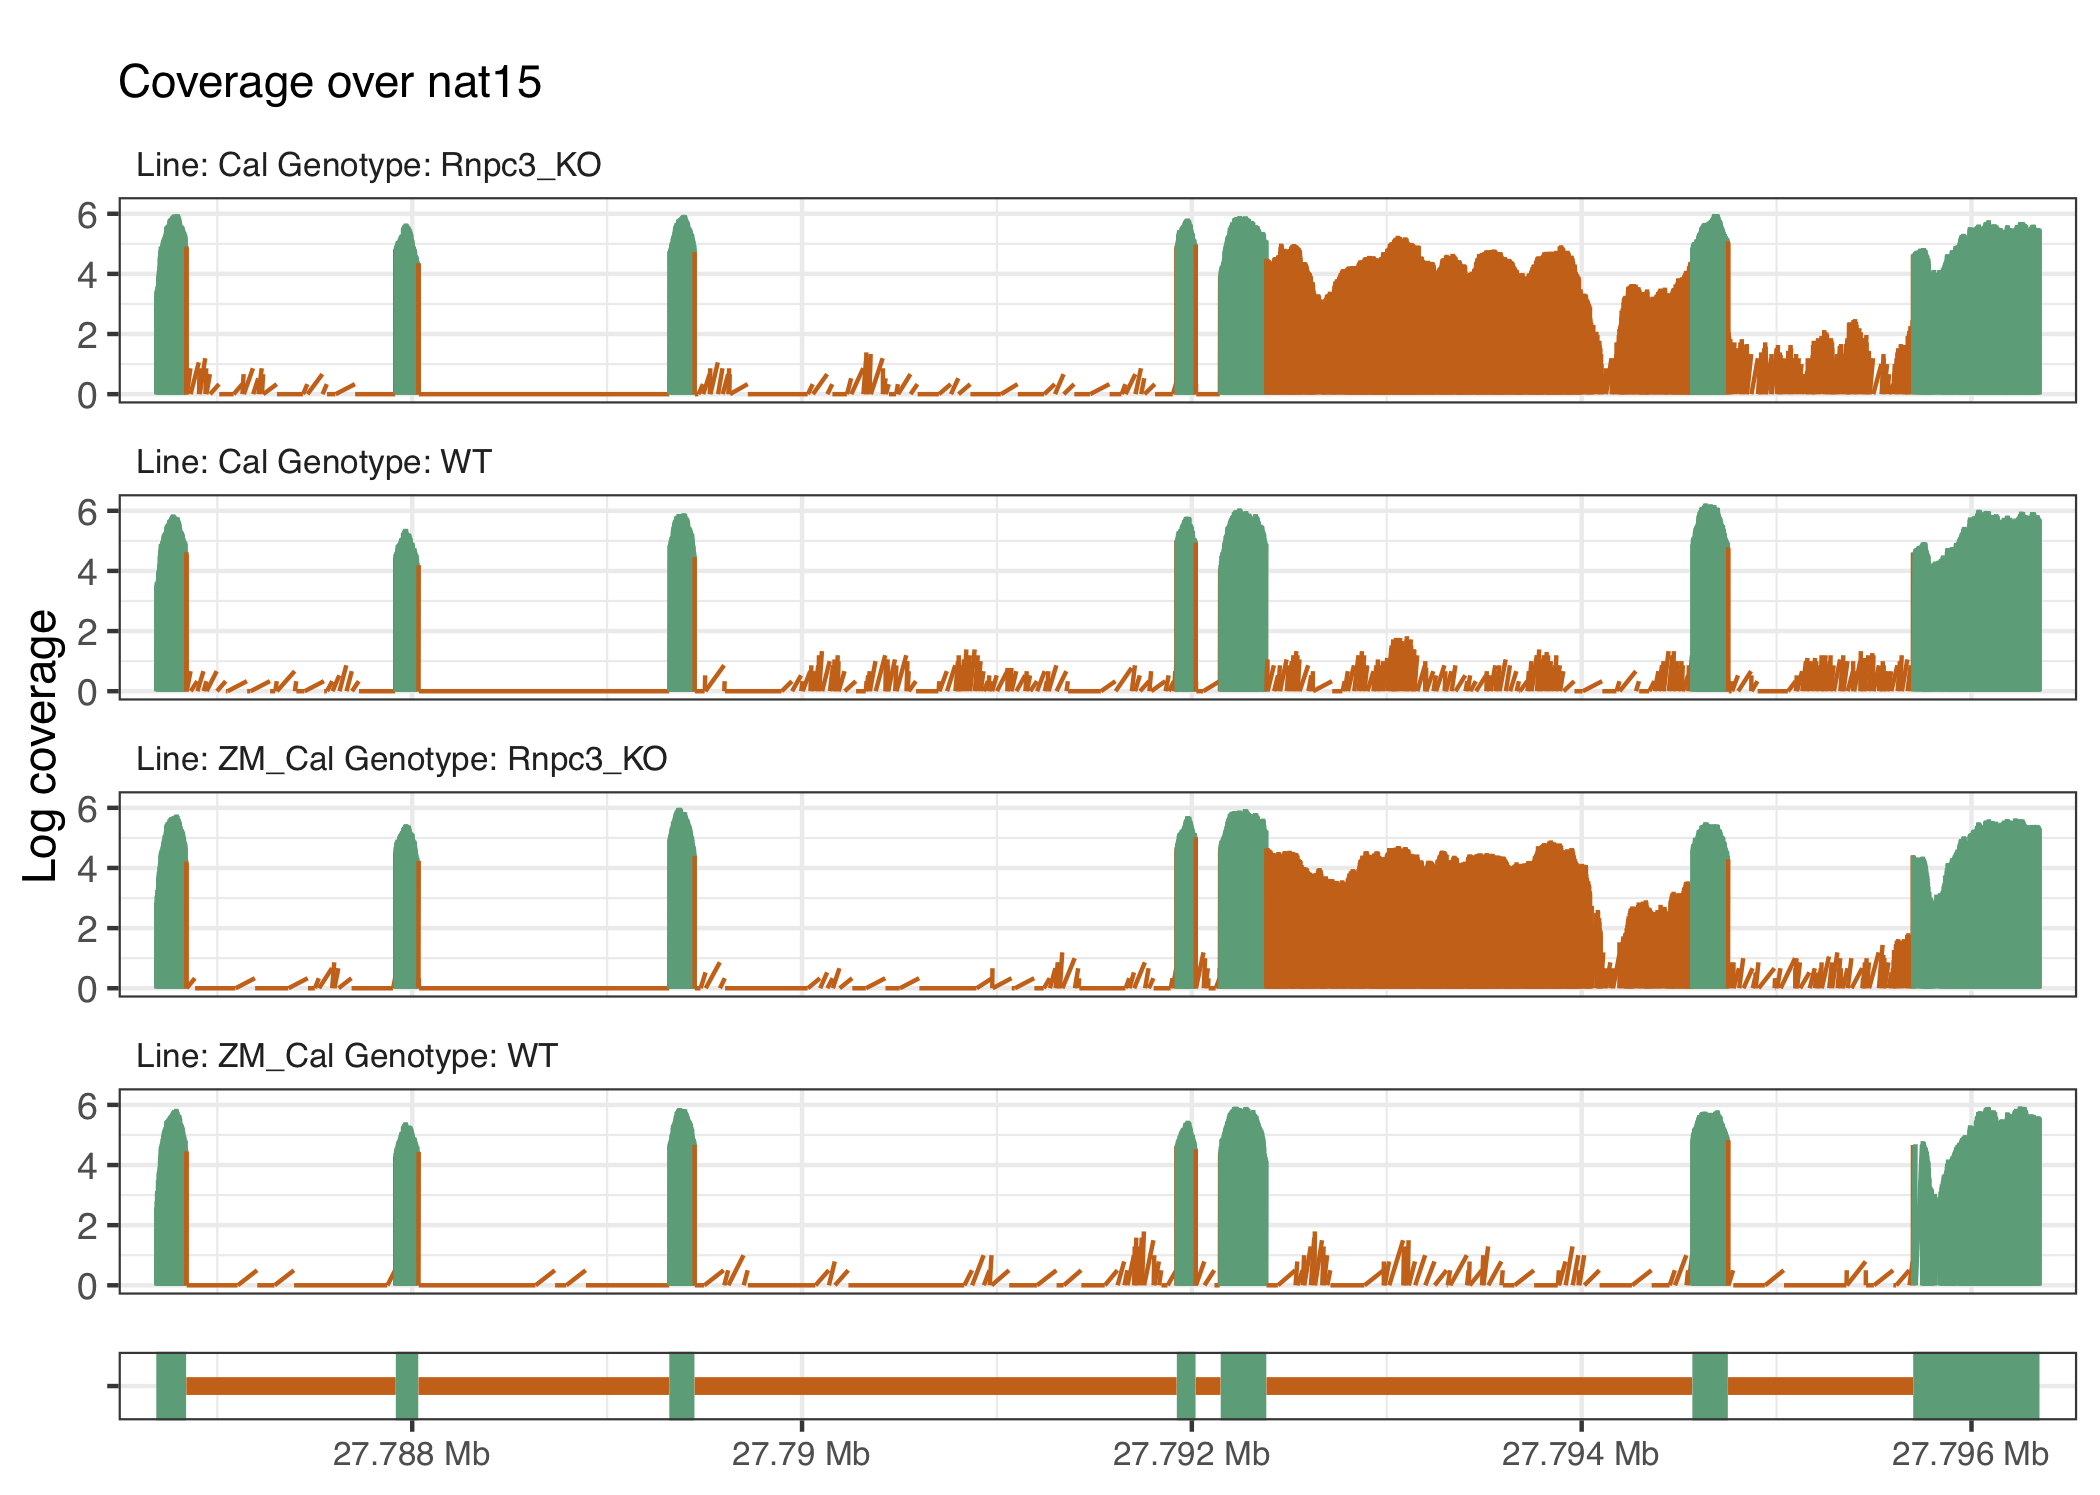
Figure 4.6: The gene nat15 exhibits another example of U12 intron retention, located at around 27.93Mb, in the rnpc3 knockout groups.
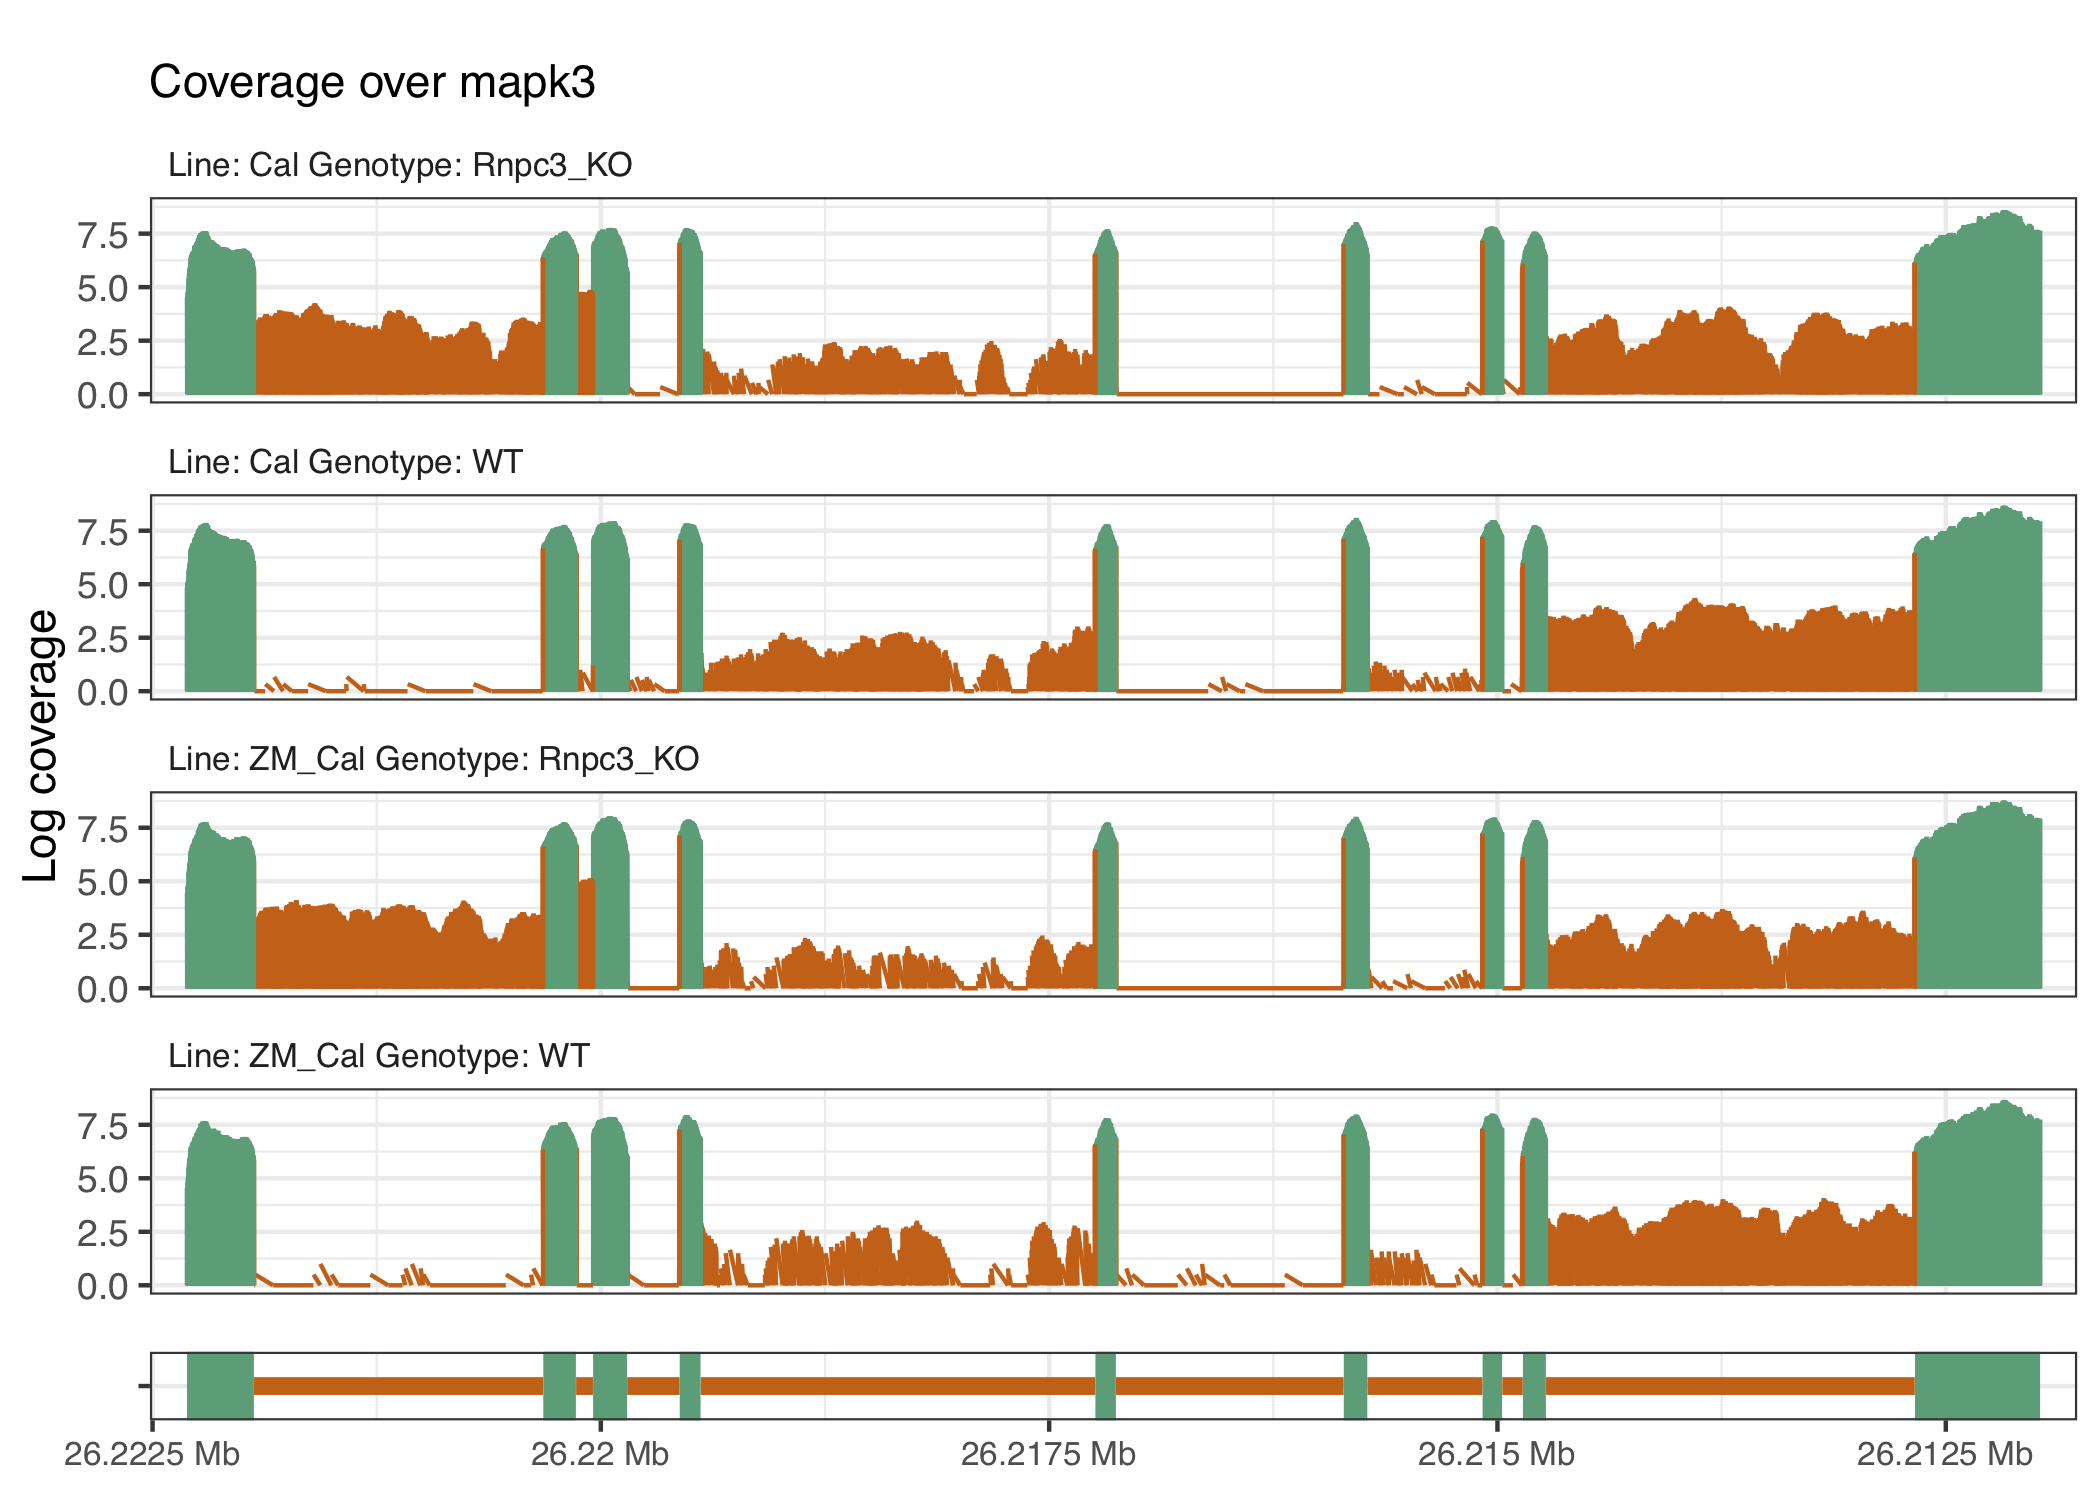
Figure 4.7: The gene mapk3 appears to have intron retention close to the start of the gene that have different impacts downstream, which result in different IR profiles between the knockout and wild-type groups.
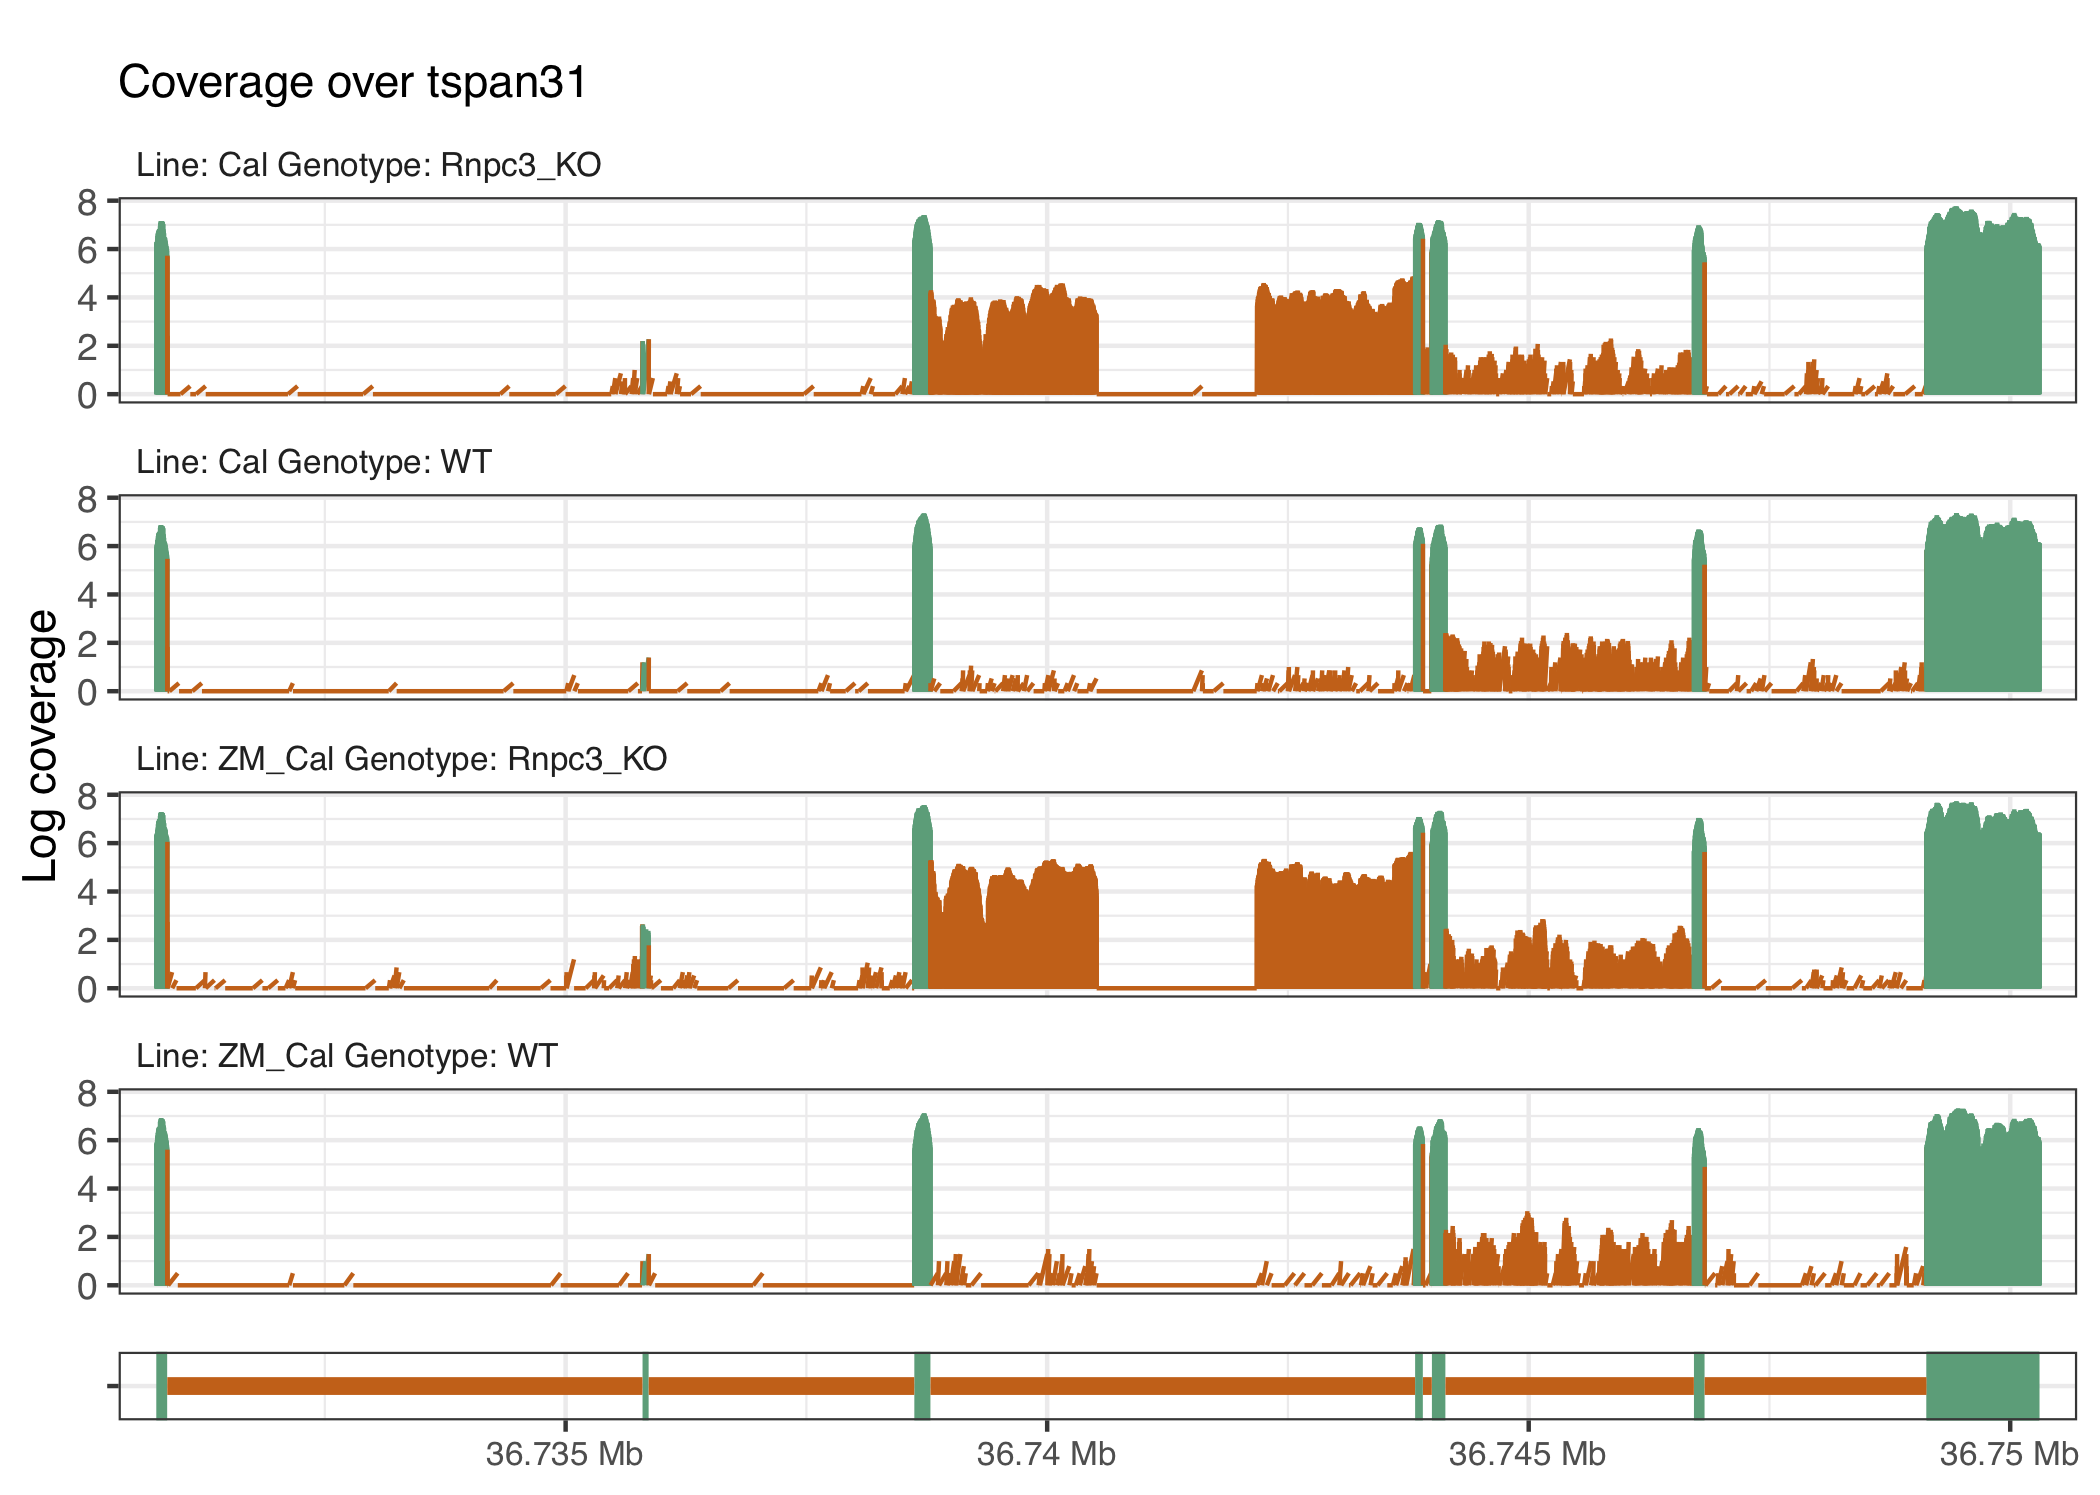
Figure 4.8: The gene tspan31 has a potential cryptic splice site within the intron retained in the knockout groups.