Chapter 1 Introduction
Exploratory data analysis (EDA) is a vital element of the modern statistical workflow - it is an analyst’s first pass at understanding their data; revealing all its messes and uncovering hidden insights (Tukey 1977; Grolemund and Wickham 2017). It is an iterative process involving computation and visualization, leading to new hypotheses that can be tested and formalised using statistical modelling (Figure 1.1). As datasets grow in complexity and become increasingly heterogeneous and multidimensional, the use of EDA becomes vital to ensure the integrity and quality of analysis outputs. This is certainly true in high-throughput biological data science, where constraints on computation time and memory, in addition to the analyst’s time, makes EDA difficult and neglected, which impacts the robustness and reliability of any downstream analysis.
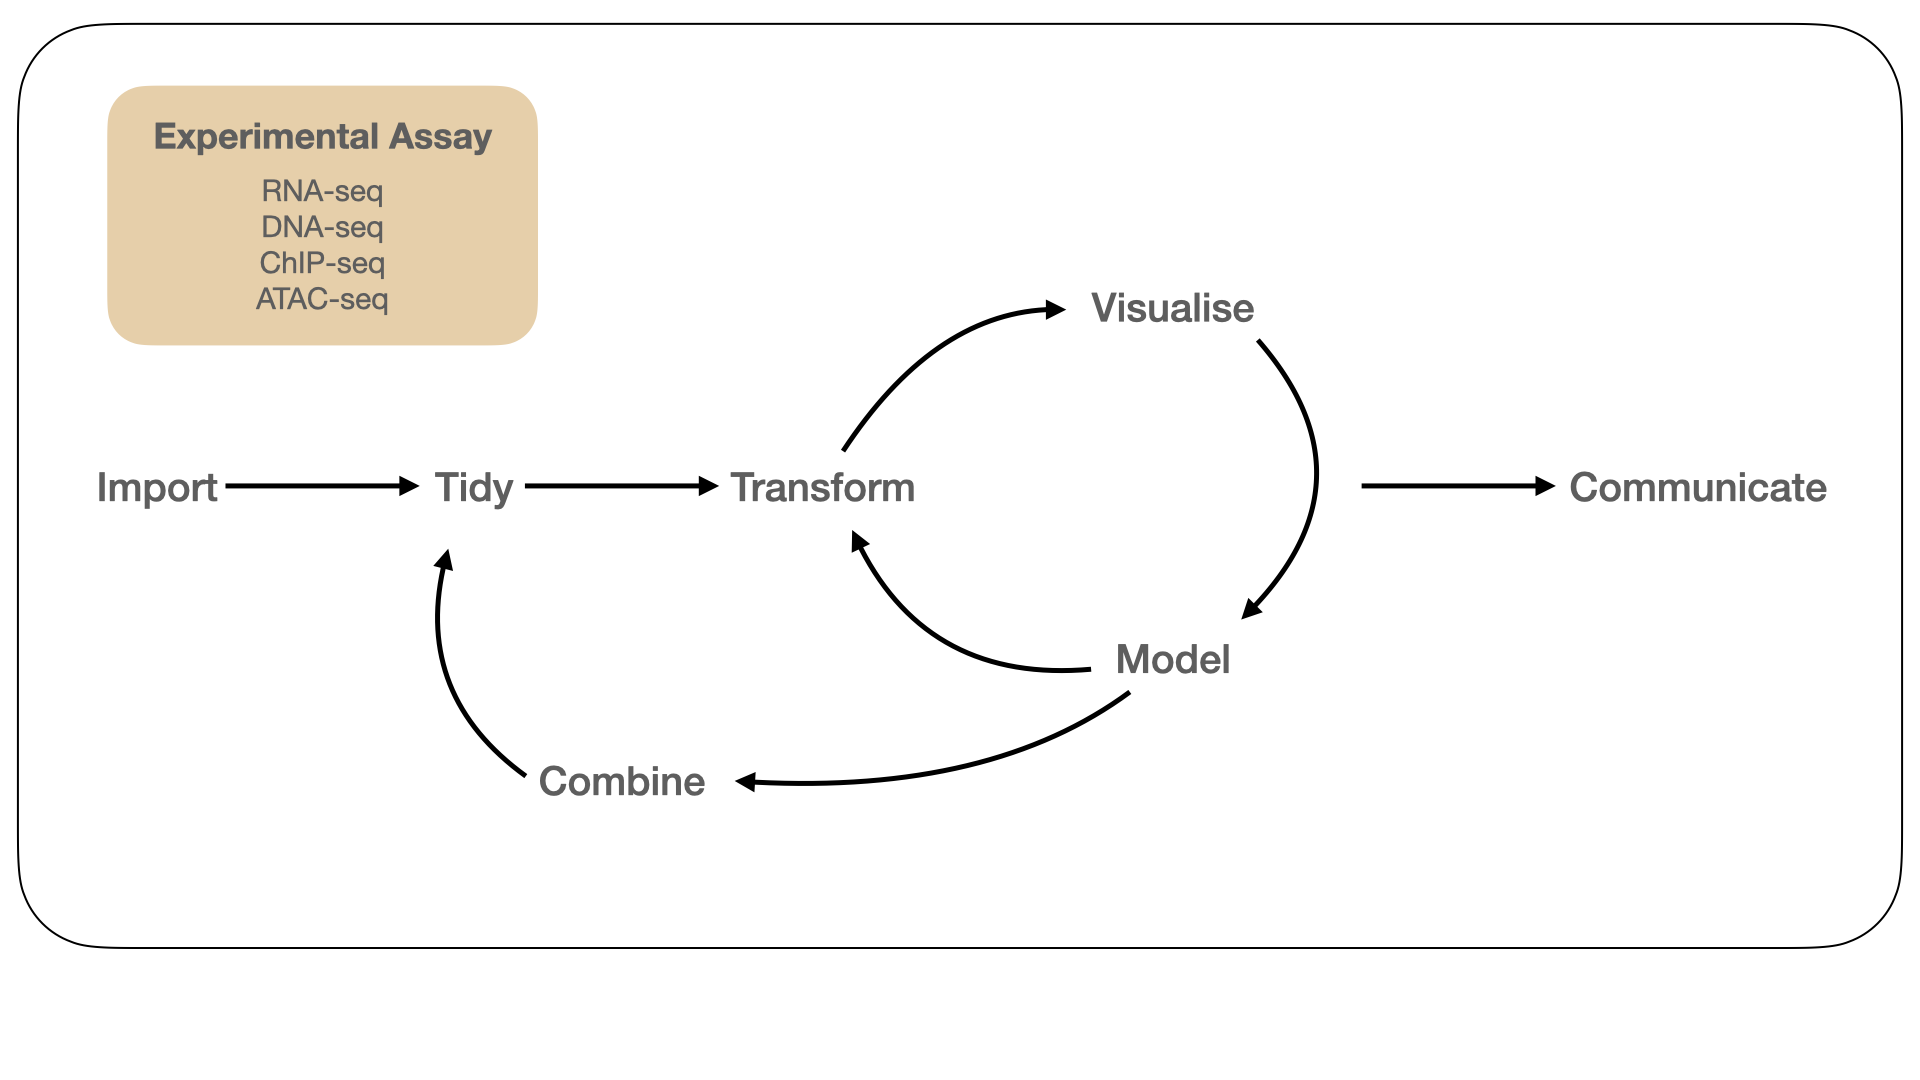
Figure 1.1: An idealised model of the biological data science workflow (adapted from Grolemund and Wickham (2017)). We begin with data generated from one or more biological assay(s) corresponding to a research hypothesis or question. Our primary focus is on data generated from bulk assays that measure gene expression (RNA-seq), genetic variation (DNA-seq), and gene regulation (ChIP-seq, ATAC-seq). Throughout this process, we need computational tools to gain insight into the biology under study and communicate our analysis in a reproducible manner.
This thesis focuses on core aspects of EDA as part of a biological data science workflow: wrangling, integration and visualisation, with a focus on applications to genomics and transcriptomics. To begin we discuss wrangling biological data using a coherent representation and programming interface (Figure 1.2). Section 1.1 introduces a grammar-based framework for transforming genomics data that is described in Chapter 2. We then look at integrating data and model outputs over genomic regions to gain biological insight (1.3). Section 1.2 introduces a framework for incorporating genomic regions over multiple assays, described in Chapter 3, while 1.3 discusses finding ‘interesting’ genomic regions via combining multiple summaries of a single assay, described in 4. Next, we consider the challenges in visualising high dimensional data (Figure 1.4). Section 1.4 introduces an interactive visualisation approach for understanding non-linear dimension reduction techniques described in Chapter 5. Lastly, in Chapter 6 describes the outputs of the thesis and plans for future developments.