4.1 Introduction
In high-throughput sequencing data sets, coverage is the estimated number of reads that overlap a single position of the reference genome, and is important for assessing sequencing data quality and used in many different aspects of omics analysis such peak-calling in ChIP-seq or variant calling in DNA-seq (Sims et al. 2014). Here we emphasise looking at coverage traces to find biological events of interest, rather than only relying on numerical summaries of the data (Figure 4.1. By faceting these traces over combinations of the experimental design and with their biological context such as gene annotations, we can gain an insight into biological signal under study. Of course, due to the sheer size of most reference genome annotations it would take an extremely long time for an analyst to look at every single possible region where there is some interesting signal within the coverage trace. Because visualisation does not scale, we need to search the possible space of coverage traces and provide diagnostics for identifying traces with interesting biology. We have taken inspiration from visualisation literature; in particular the idea of scatter plot diagnostics (“scagnostics”) for summarising the space of all possible 2D scatter plots to a small number of descriptors of each scatter plots properties such as density or monotonicity (Friedman and Stuetzle 2002; Wilkinson, Anand, and Grossman 2005). Similarly, searching for unusual time series via estimating descriptors such as seasonality or autocorrelation, and visualising those descriptors instead (Hyndman, Wang, and Laptev 2015).
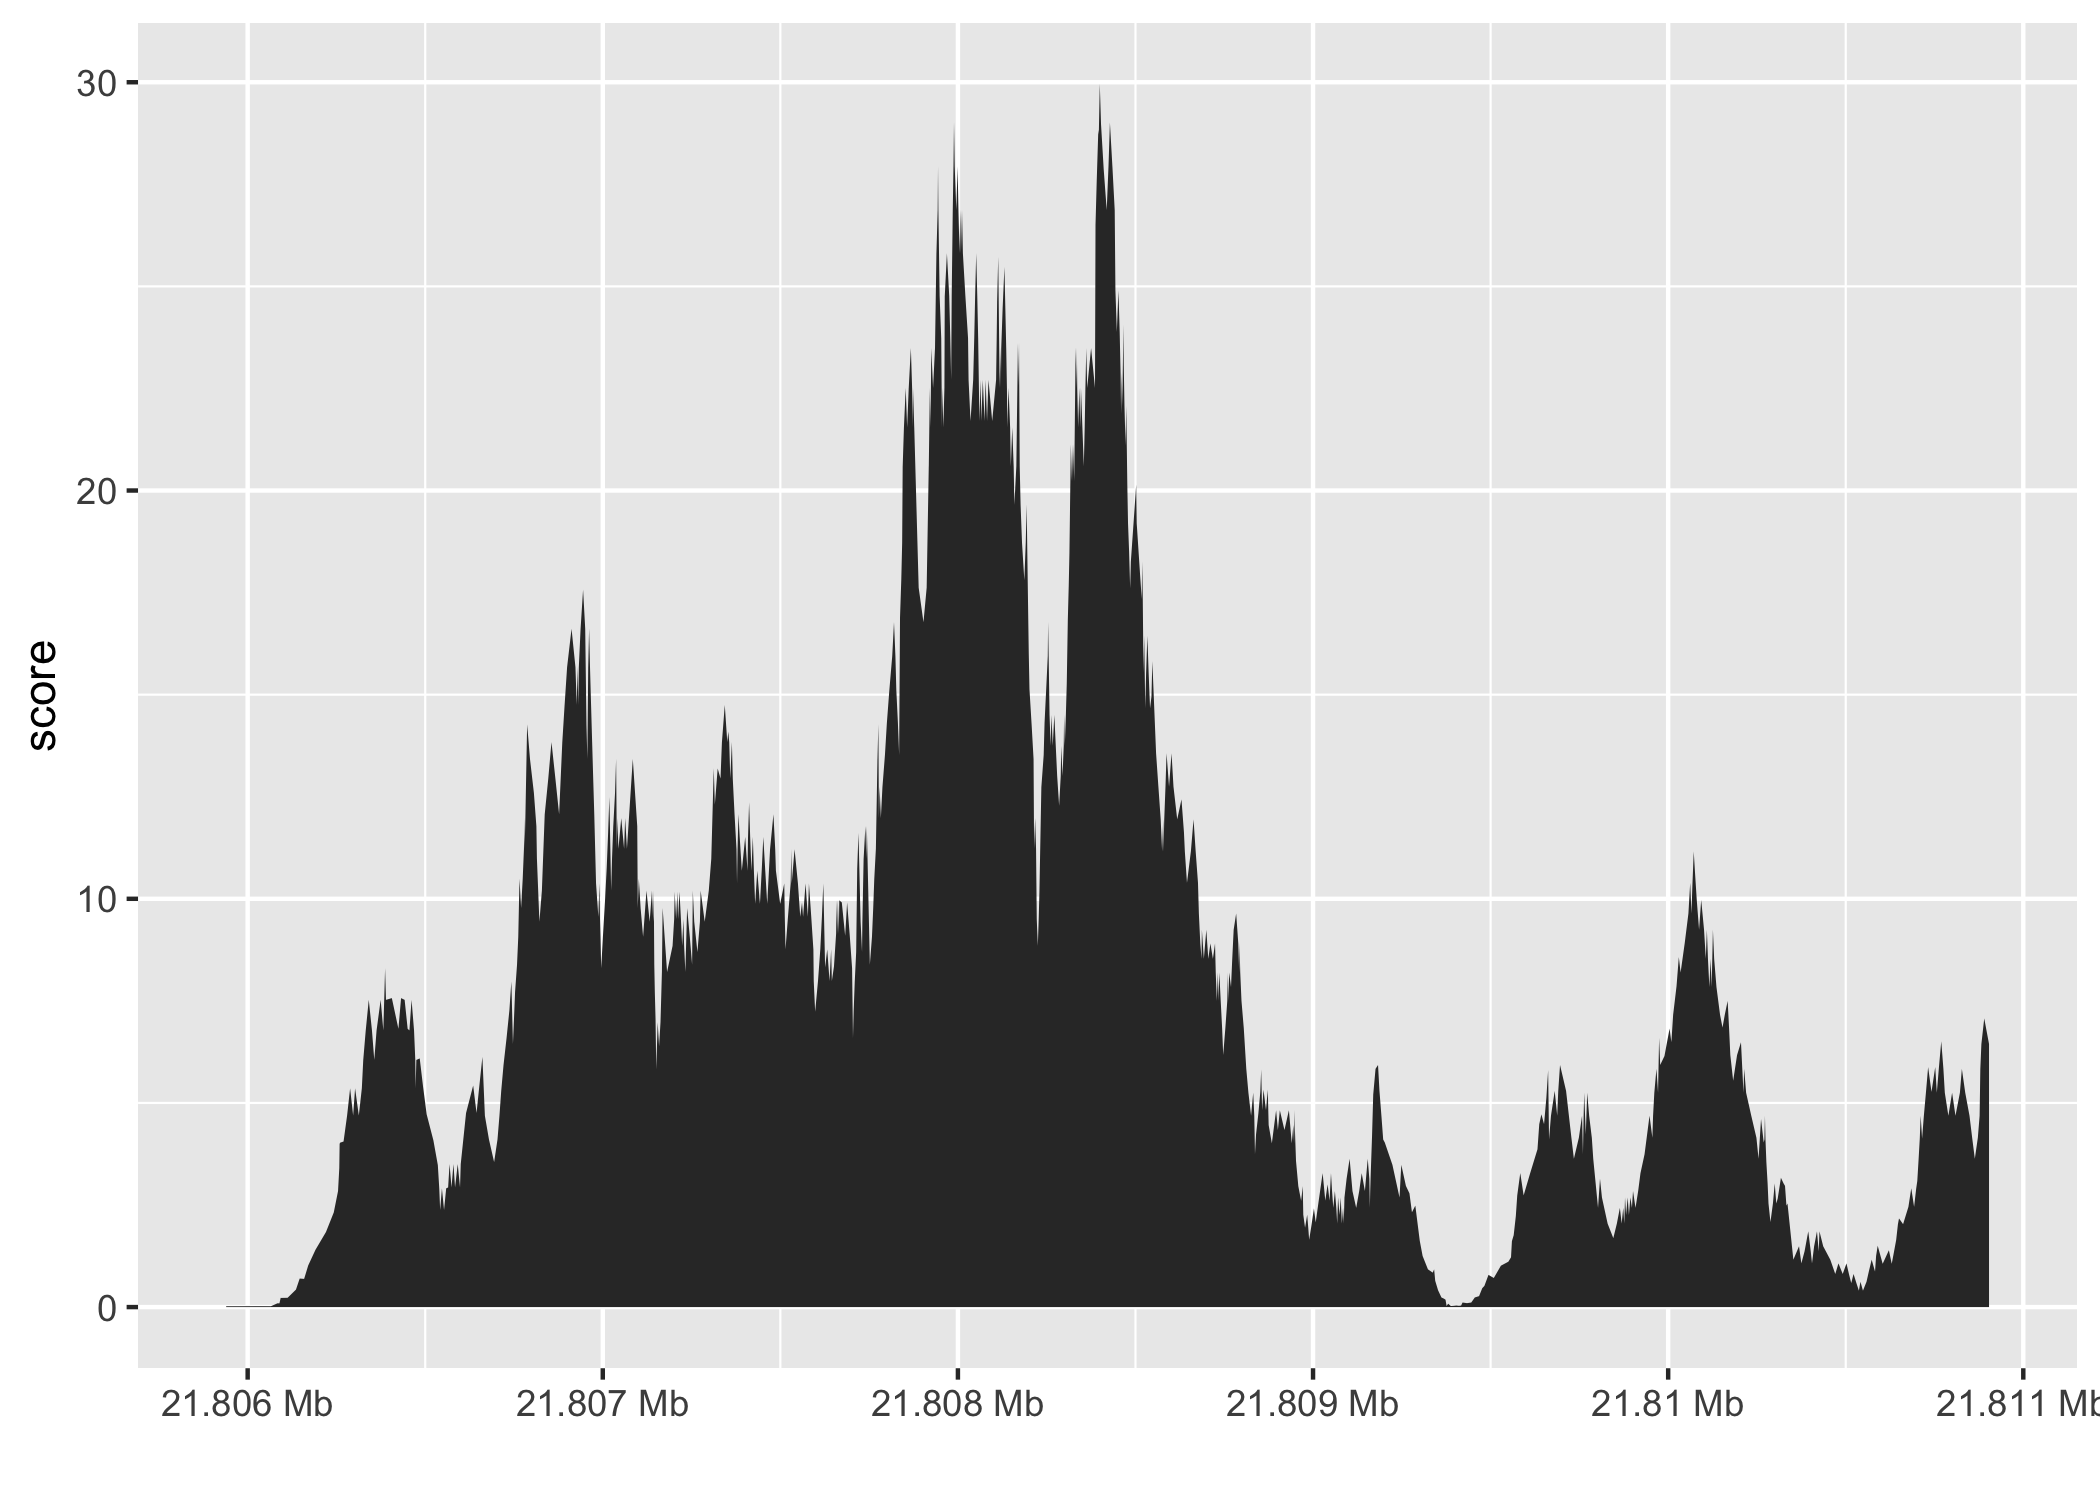
Figure 4.1: An illustrative coverage trace plot from Chapter 2. The coverage score is defined as the number of reads that overlap a single base position within a reference genome. For example, at position 21.807 of chromosome 8 there are approximately 12 reads overlapping it.
Although there are many flexible and powerful software tools, like BEDtools or deepTools, for exploring and estimating coverage from common genomic data formats (Quinlan and Hall 2010; Ramı́rez et al. 2014), it is advantageous to have tooling that is tightly coupled to a statistical computing language such as R. This allows interoperability between other software packages for data wrangling, visualisation and modelling within the ecosystem of the language that may not be possible with a single command line tool. There are also gains in reproducibility as analysts do not have to move between multiple software suites to explore their processed transcriptomics data.
In S. Lee et al. (2020), we showed that there is evidence that a major source of intron reads in RNA-seq datasets is pre-mRNA, and sought data analysis techniques to unravel different aspects of intron signal. In light of this, we made the assumption that most intron reads do not necessarily point to intron retention (IR) events, and developed a workflow based on combining multiple summary statistics, “data descriptors”, to find coverage traces that appear to have IR-like events by collapsing coverage scores over a design matrix alongside the exonic and intronic parts of a gene. To do this we developed a new R package called superintronic that provides tooling for exploratory coverage analysis by extending and integrating our previous software package, plyranges (Lee, Cook, and Lawrence 2019).
In this paper, we describe methodology for establishing data descriptors by turning coverage vectors into long form tidy data using superintronic and plyranges. We provide a workflow below using a zebrafish RNA-seq dataset for developing data descriptors to find IR like coverage traces within genes known to have minor class splicing events.